Pamela M. Aaltonen, Purdue University and Catherine Lynne Troisi, The University of Texas Medical Branch
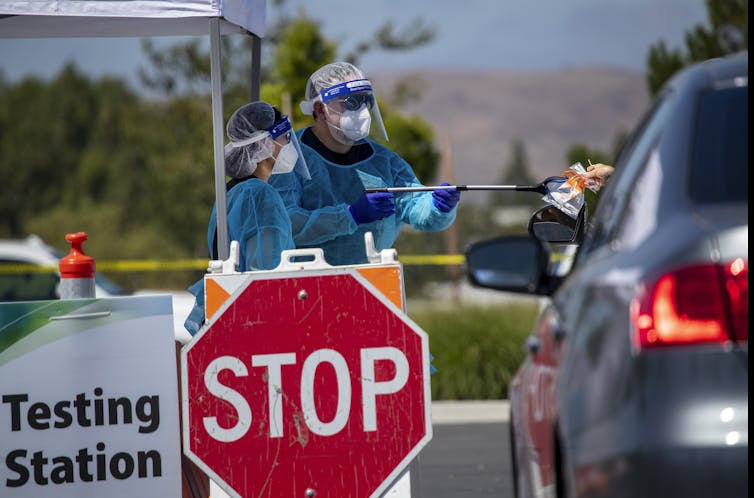 |
| In Irvine, Calif., a COVID-19 test is retrieved from a drive-in patient at Orange County Great Park. For four weeks, the testing station will see 520 patients per day. Getty Images / Allen J. Schaben |
Different stories are told depending on the dashboard. But one thing is certain: These indicators lag behind the actions we take, or don’t take, on COVID-19.
As researchers who focus on public health, we can tell you that a fully accurate, real-time snapshot of the progress of the virus isn’t possible.
Some don’t get tested
There are many reasons for this. Here’s one: diagnostic testing data are incomplete. Someone infected with COVID-19 must first come in contact with the virus either through the air or (less likely) environmental surfaces.
Symptoms show between two and 14 days later. But at least 40% of those infected will never manifest symptoms, or show such mild ones they don’t even suspect they have COVID-19. So they may never get tested, which means they won’t show up in the total number of tests, or the total number of cases.
Another example: because of the lack of testing availability – a widespread problem in the U.S. since the start of the pandemic – not everyone who should be tested gets a test.
And another: the tests themselves are not perfect. Up to one-third who get a negative result may actually be infected. This happens because they are tested before they have a viral load sufficient enough for detection. Or maybe the sampling is not adequate. Or perhaps the test itself simply failed.
Case numbers don’t tell the full story
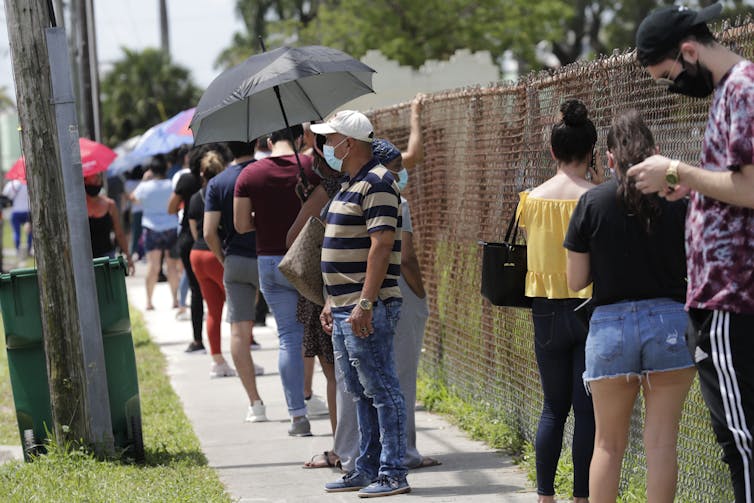 |
| Florida is now the epicenter of the U.S. pandemic. In Opa-locka, people wait in line outside a COVID-19 testing site. AP Photo/Lynne Sladky |
Case counts actually reflect what was happening in a community weeks earlier. Four weeks, for instance, could elapse between the time a person is exposed to the virus and when they are reported as a case.
Even the best testing results often take a week to report to public health authorities, and longer to appear on dashboards. Some testing results, seriously delayed, may take ten days or more.
Other factors impact the metrics. Laboratory results, often released in batches, may introduce artificial variation in case numbers. Someone who tested two days ago, then got a result back immediately, might be added on the same day as someone who was sick two weeks ago, but whose test results were delayed. To smooth out these variations, it helps to look at a rolling seven-day case average.
Hospitalization is a clearer metric for assessing the level of community disease. Those who are seriously ill, in most cases, will be hospitalized whether previously tested or not.
Data suggests roughly one in five infected persons are hospitalized. Individuals seem to do okay for the first week, with more life-threatening symptoms showing in the second. That means hospitalizations represent exposures that happened three or four weeks earlier.
Again, a seven-day rolling average evens out artificial variations. There is one caveat for this: Though hospitalization is a useful metric, only about 20% of infected people need it. That means hospitalization numbers alone underestimate the number of people infected and what age groups they represent.
States vary on cause of death
The death numbers are not a reliable indicator either. In some states, to count as a COVID-19 death, the deceased must have had a test reporting positive. In other states, probable cases are reported.
As clinicians learn how to better treat COVID-19, fatality rates are dropping. Deaths, the longest lagging indicator, reflect people who were infected six or eight weeks earlier. When comparing one region to another, deaths are best expressed as rates – a ratio of deaths to population.
Another issue: News reports do not always clearly distinguish between diagnostic testing, which shows if you currently have COVID-19, and antibody testing, which shows if you had it in the past, and now harbor antibodies that can fight it.
So far, however, antibody testing has not provided a useful picture of who has been infected and who has not. Once that happens, it could provide researchers and clinicians with some indicators on how widely the virus has spread.
Though the dashboards are ubiquitous on television, none of these frequently used indicators they feature is perfect. Still, taken together, they provide a reasonable approximation of COVID-19 transmission in communities. But as authorities make decisions, they should take into account the numbers are weeks old.
What does this mean to you? Understanding these limitations may help you understand your risk. We are still in the midst of a pandemic that is not under control. Being educated will help all of us from becoming a part of tomorrow’s lagging indicators.
Pamela M. Aaltonen, Professor Emerita; Immediate Past President, APHA, Purdue University and Catherine Lynne Troisi, Associate professor, Management, Policy, and Community Health and Epidemiology, The University of Texas Medical Branch
This article is republished from The Conversation under a Creative Commons license. Read the original article.