New model accounts for the effect of behavior changes to predict COVID-19 cases
Brown University
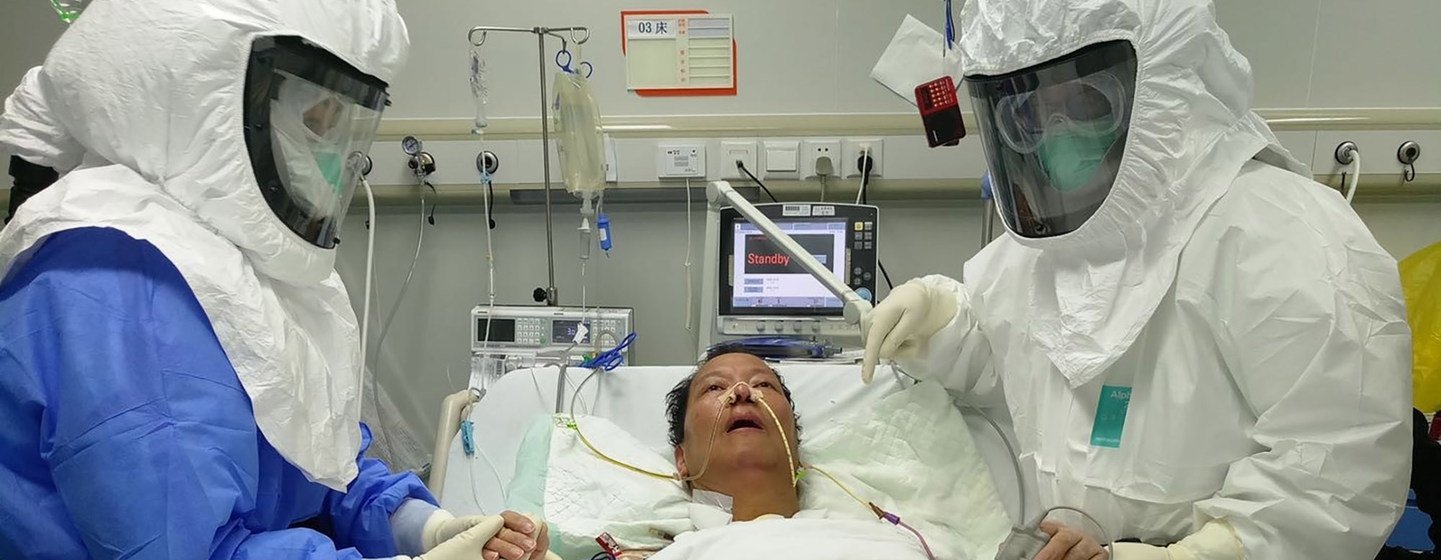
By adding behavioral components to an infectious disease model, Brown University researchers have developed a new modeling approach that captures the peaks and valleys in new COVID-19 cases seen over the past 16 months.
The
approach, published in the journal Scientific
Reports, could be useful in forecasting the future trends in the
current pandemic, as well as in predicting the course of future
ones.
“We
know that people’s behavior matters in terms of how an infection is spread,”
said Vikas Srivastava, an assistant professor of engineering at Brown and
principal investigator of the research. “We wanted to see if we could quantify
those behavioral aspects, incorporate them into a model and see whether that
model is able to capture waves of infection rates we saw in the U.S. and
elsewhere.”
A commonly used approach to modeling infectious disease transmission is what’s known as an SIR model. The approach separates a population into distinct categories: susceptible, infected and recovered.
The model moves people from
one category to another according to two parameters. The transmissibility of
the disease, along with the rate at which people contact each other, predict
how quickly people move from susceptible to infected. The rate of recovery
moves people from infected to recovered. (“Recovered” in these models generally
means “no longer contagious,” which also includes those who have died from the
infection.)
The standard SIR model produces a curve with a single peak — the one that infectious disease experts urged people to flatten through social distancing, masks and other measures that reduce virus transmission.
But over the last 16
months, actual case rates in individual states, in the U.S. as a whole and in
other nations didn’t produce a single curve. Instead, they produced multiple
waves of infection that created a significant challenge for the infectious
disease modeling community, Srivastava says.
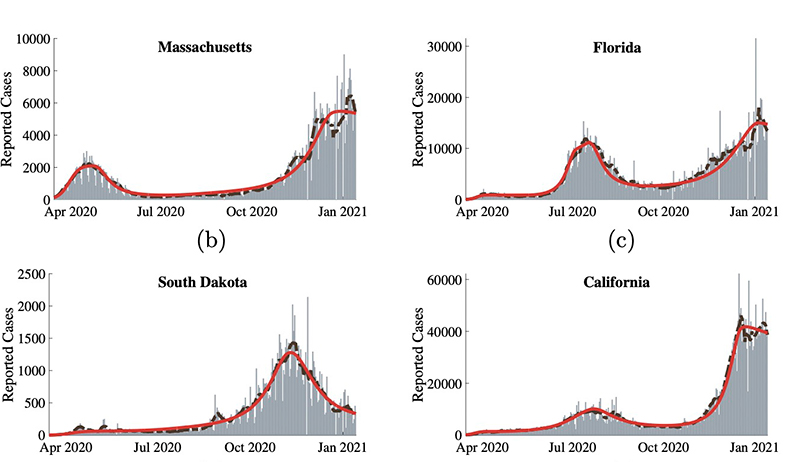 |
| The model output (red lines) captures multiple peaks of cases (gray bars) seen across the U.S. |
As the pandemic unfolded, Srivastava was teaching a class that included a section on infectious disease modeling in Brown’s School of Engineering. He and his students were surprised to see the mismatch between model predictions and actual case rates.
“We
saw cases going up and down, creating multiple peaks, but models were falling
short in capturing it,” Srivastava said. “That’s what got us thinking about
using population behavior and response as a way to explain and predict what is
happening.”
Srivastava worked with two Brown undergraduate students, Zachary LaJoie and Thomas Usherwood, to develop the new modeling strategy. They modified a standard SIR model to include the effects of vaccination, and also added two behavioral parameters to the model.
The first, “level of caution,” estimates people’s tendency toward safe behavior — social distancing, mask-wearing and other safety measures — as reported cases increase. The parameter also captures government actions in response to rising case rates, such as closures and quarantines, that increase safe behavior.
A second parameter, “sense of
safety,” models people’s confidence in a return to pre-pandemic activities as
more people get vaccinated.
The
team then used an optimization algorithm to calibrate values for the new
parameters based on case rates reported in the U.S. With the parameters
optimized, the team found that the model accurately reproduced case rates
throughout the pandemic in the U.S. as a whole and in individual states and
cities.
“When
we looked at New York City, for example, we saw a spike in our level of caution
variable right around the same time government action went into effect in late
March,” LaJoie said. “Then as cases went down later on, we saw the level of
caution come down, and there was another surge in cases going into the
holidays.”
With the model properly fit to the data, it enables insights into how the pandemic may unfold in the future. For example, the team was able to measure how different rates of vaccine uptake might affect case rates.
Rising rates of
vaccination could drive a reduction in cases, but they could also reduce levels
of caution and increase the sense of safety among the unvaccinated. That could
put an upward pressure on case rates even as vaccines are pulling them down. In
fact, the model predicts scenarios where brief periods of rising infection
rates occur as vaccines are rolled out, before they eventually begin to decline
again.
Increasing
rates of vaccination can cause an increased sense of safety among the
unvaccinated, which could drive cases higher for a short period during
vaccination rollouts.
In
the U.S., for example, the model captures a short period of increasing
infection in mid-April before rates began falling again. Larger surges in
places like India look similar to the more extreme post-vaccination surges the
model predicts. At its current rates of vaccination, the model predicts that
cases in the U.S. should approach zero by August 2021.
Insights
like that, the researchers say, could be useful in places where vaccination
programs are just getting underway.
“When
we developed the model, we focused on the U.S., but it would definitely be
useful for making predictions in other places like India, Europe or South
America where case rates are still pretty high,” LaJoie said.
The
modeling approach could also be applied to future outbreaks or pandemics.
“There's
really nothing in this model that limits it only to COVID-19 as a disease,”
Usherwood said. “We think this has applicability to any situation where
people’s behavior is important, which is basically any infectious disease.”