Better Data needed for proper planning
Laura Oleniacz, NC State News Servicesljolenia@ncsu.edu
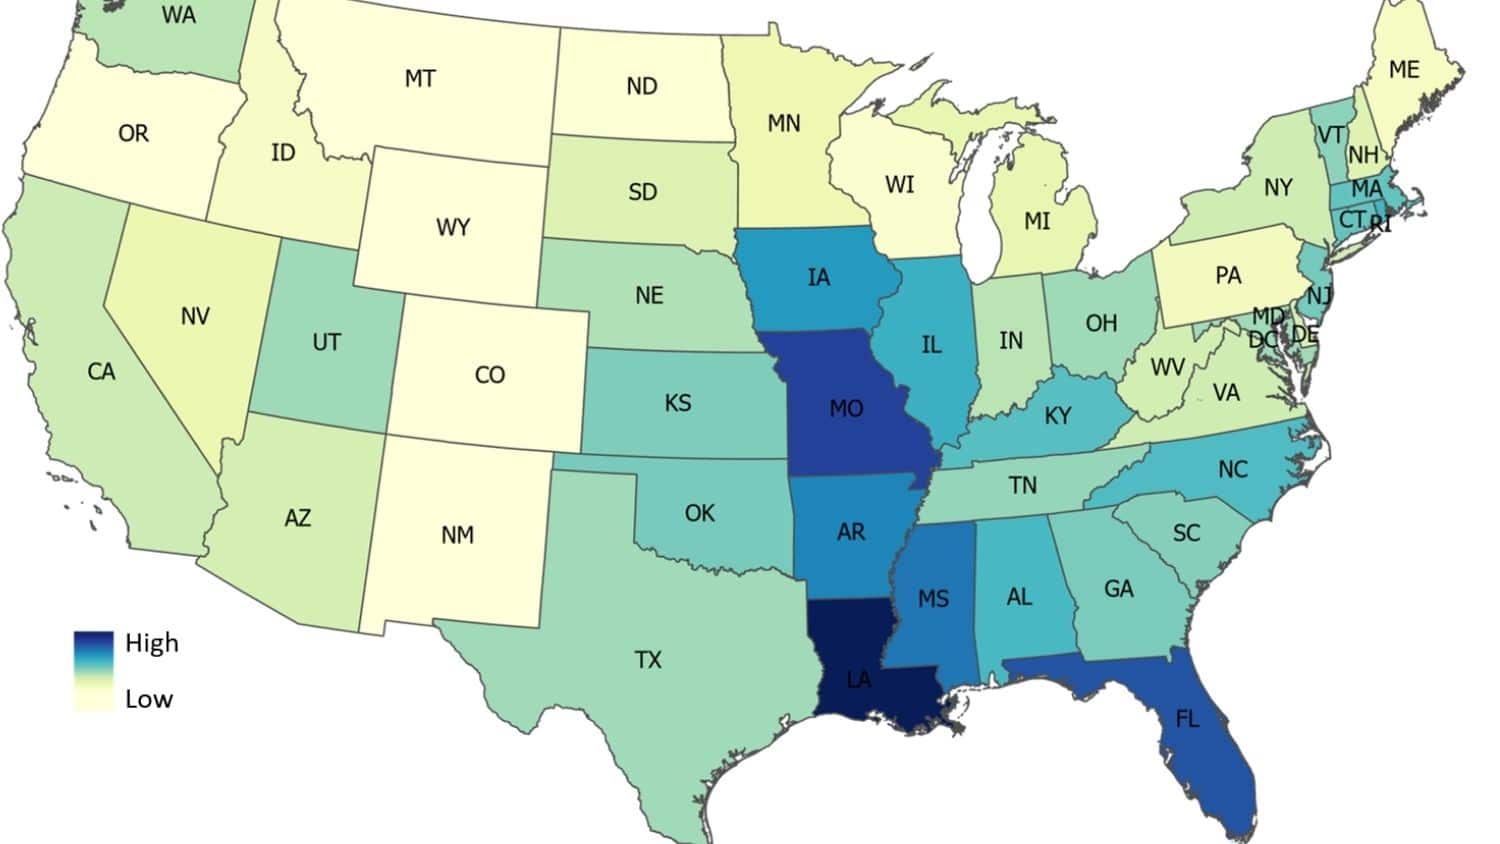 |
| Map of the United States showing predicted average flood damage risk by state or district. Credit: Elyssa Collins |
In a new study, North Carolina State University researchers used artificial intelligence to predict where flood damage is likely to happen in the continental United States, suggesting that recent flood maps from the Federal Emergency Management Agency do not capture the full extent of flood risk.
In the study, published in Environmental
Research Letters, researchers found a high probability of flood
damage – including monetary damage, human injury and loss of life – for more
than a million square miles of land across the United States across a 14-year
period. That was more than 790,000 square miles greater than flood risk zones
identified by FEMA’s maps.
“We’re seeing that there’s a lot of flood damage being reported
outside of the 100-year floodplain,” said the study’s lead author Elyssa
Collins, a doctoral candidate in the NC State
Center for Geospatial Analytics. “There are a lot of places
that are susceptible to flooding, and because they’re outside the floodplain,
that means they do not have to abide by insurance, building code and land-use
requirements that could help protect people and property.”
It can cost FEMA as much as $11.8 billion to create national Flood Insurance Rate Maps, which show whether an area has at least a 1% chance of flooding in a year, according to a 2020 report from the Association of State Floodplain Managers. Researchers say their method of using machine learning tools to estimate flood risk offers a way of rapidly updating flood maps as conditions change or more information becomes available.
“This is the first spatially complete map of flood damage
probability for the United States; wall-to-wall information that can be used to
learn more about flood risk in vulnerable, underrepresented communities,”
said Ross Meentemeyer, Goodnight Distinguished
Professor of Geospatial Analytics at NC State.
To create their computer models, researchers used reported data
of flood damage for the United States, along with other information such as
whether land is close to a river or stream, type of land cover, soil type and
precipitation. The computer was able to “learn” from actual reports of damage
to predict areas of high flood damage likelihood for each pixel of mapped land.
They created separate models for each watershed in the United States.
“Our models are not based in physics or the mechanics of how
water flows; we’re using machine learning methods to create predictions,”
Collins said. “We developed models that relate predictors – variables related
to flood damage such as extreme precipitation, topography, the relation of your
home to a river – to a data set of flood damage reports from the National
Oceanic and Atmospheric Administration. It’s very fast – our models for the
U.S. watersheds ran on an average of five hours.”
The actual flood damage reports they used to “train” the models
were publicly available reports from NOAA made between December 2006 and May of
2020. Compared with recent FEMA maps downloaded in 2020, 84.5% of the damage
reports they evaluated were not within the agency’s high-risk flood areas. The
majority, at 68.3%, were located outside of the high-risk floodplain, while
16.2% were in locations unmapped by FEMA.
When they ran their computer models to determine flood damage risk, they found a high probability of flood damage for more than 1.01 million square miles across the United States, while the mapped area in FEMA’s 100-year flood plain is about 221,000 square miles.
Researchers said there are factors
that could help explain why the differences were so large, including that their
machine-learning-based model assessed damage from floods of any frequency,
while FEMA only includes flooding that would occur from storms that have a 1%
chance of happening in any given year.
“Potentially, FEMA is underestimating flood damage exposure,”
Collins said.
One of the biggest drivers of flood damage risk was proximity to
a stream, along with elevation and the average amount of extreme precipitation
per year. The three Census regions with the highest probability were in the
Southeast. Louisiana, Missouri, the District of Columbia, Florida and
Mississippi had the highest risk of any U.S. state or district in the
continental United States. Of the 30 most high-risk counties, North Carolina
had three: Dare, Hyde and Tyrrell.
In their model, researchers used historical climate data. In the
future, they plan to account for climate change.
In the meantime, researchers say their findings, which will be
publicly accessible, could be useful for helping policymakers involved in
land-use planning. They also represent a proof-of-concept method for
efficiently updating flood maps in the future.
“There is still work to be done to make this model more
dynamic,” Collins said. “But it’s part of a shift in thinking about how we
approach these problems in a more cost-effective and computationally efficient
manner. Inevitably, with climate change, we’re going to have to update these
maps and models as events occur. It would be helpful to have future estimates
that we can use to prepare for whatever is to come.”
The study, “Predicting flood damage probability across the
conterminous United States,” was published online Feb. 21, 2022, in Environmental
Research Letters. In addition to Collins and Meentemeyer, other authors
included Georgina M. Sanchez, Adam Terando, Charles C. Stillwell, Helena
Mitasova and Antonia Sebastian. This project was supported by the U.S.
Geological Survey Southeast Climate Adaptation Science Center (G19AC00083) and
the North Carolina State University Sea Grant program (R/MG-2011).