State claims progress toward meeting climate mandates
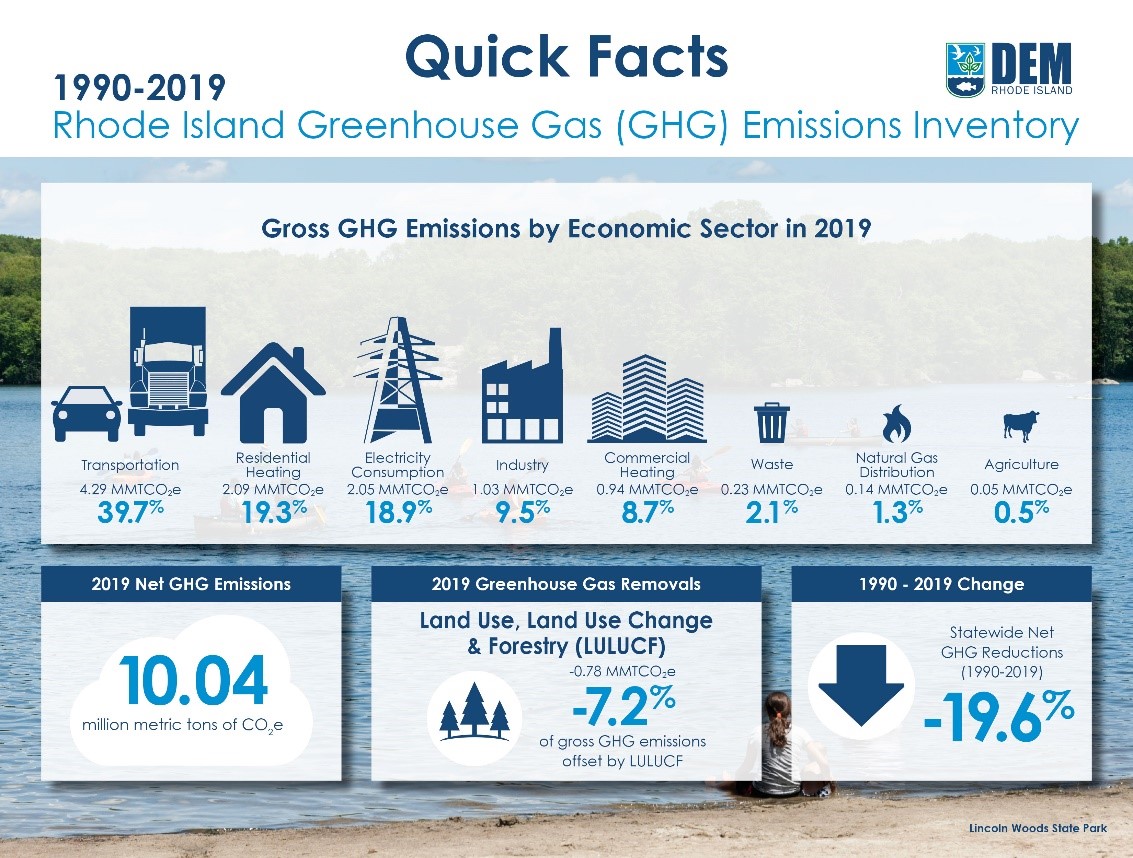
The Department of Environmental Management (DEM) announced that Rhode Island's gross greenhouse gas (GHG) emissions decreased 7.4% between 2018 and 2019. Over a longer timeframe, net emissions decreased 19.6% between 1990 and 2019.
"The GHG emissions inventory indicates progress toward Act on Climate mandates but does not lessen the urgency with which my administration is working to address the effects of climate change," said Governor Dan McKee.
"Much needs to be done and I am
looking forward to reviewing the update of the 2016 greenhouse gas reduction
plan to be reported out by the Executive Climate Change Coordinating Council
later this week."
"These measurements are important
because they show we're on the right track to meeting the mandated
benchmarks," said DEM Director Terry Gray. "But at the same time,
nobody in state government is declaring victory. Complying with the Act on
Climate is going to demand sustained, consistent action and follow-through over
many years."
Most GHG emissions in 2019 emanated from three sectors: transportation (39.7%), residential heating (19.3%), and electricity consumption (18.9%).
Between 1990 and 2019, emissions from these sectors decreased by 13.7%, 12%, and 27.4%. Two sectors' emissions were, in relative terms, much higher in 2019 than 1990: industry (+27.3%) and agriculture (+24.1%). In absolute terms, however, the differences were much smaller.
In this timeframe, emissions from industry increased 0.22 MMTCO2e and
emissions from agriculture increased 0.01 MMTCO2e (see page 7 of attached
inventory report). The difference between relative and absolute values
underlies the truism that when small totals change slightly, the percent
difference is greatly magnified.
The transportation sector continues to be
the largest source of GHG emissions. Further reductions from transportation
"are critical to meet the 2030, 2040, and 2050 Act on Climate
mandates," the report states. "Significantly more zero-emission
vehicles across weight classes will be required to meet Act on Climate emission
reduction mandates."
Along with its deep influence on policymaking, the Act on Climate changed how DEM air quality specialists conducted the 2019 inventory. Whereas most inventory years between 1991 and 2018 recorded gross GHG emissions totals only, DEM included carbon sequestration from Land Use, Land Use Change, and Forestry (LULUCF) for the 2019 inventory.
This allowed the 2019 inventory to include a net emissions total, which was important for an apples-to-apples comparison to the Act on Climate's 1990 baseline. Carbon sequestration, or removal, is the process of capturing and storing atmospheric carbon dioxide.
The DEM Division of Agriculture and Forest Environment assisted
in development of an in-house methodology to estimate carbon removed by
forestland. To properly account toward the Act on Climate's net-zero emissions
mandate by 2050, all new inventories will include a LULUCF sector.
DEM continues to collaborate with the
Connecticut Department of Energy and Environmental Protection to align and
improve electricity sector accounting practices and better quantify where
renewable energy credits are settled. This was an important step toward
accurately accounting for emissions reductions associated with the state's 100%
renewable energy standard (RES).
Like many other states that regularly perform economy-wide GHG emissions inventories, Rhode Island relies heavily on the US Environmental Protection Agency's State Inventory Tool (SIT).
Although
EPA updates the SIT annually, there is a three-year lag between the end of the
year being measured and publishing the GHG inventory in which to collect,
compile, and verify the data. This lag affects the timing of DEM's annual
emissions inventories.
Related links