Profound changes are underway in Earth’s oceans and ice – a lead author explains what the warnings mean
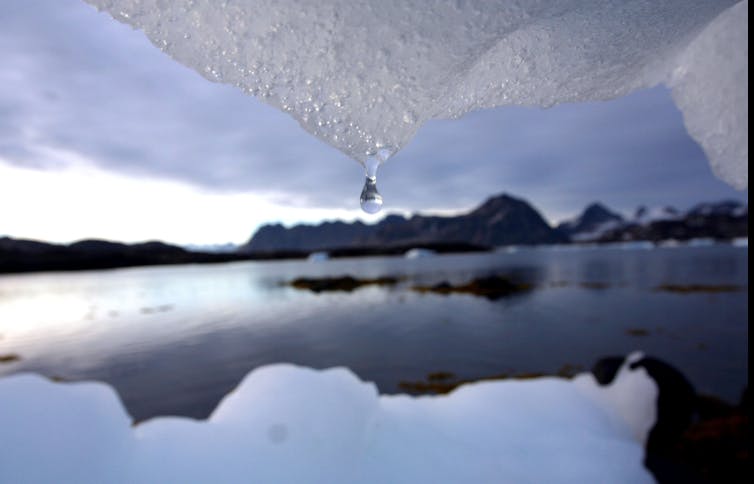 |
| What might seem like small changes, like a degree of warming, can have big consequences. AP Photo/John McConnico |
The IPCC released the first part of its much anticipated Sixth Assessment Report on Aug. 9, 2021. In it, 234 scientists from around the globe summarized the current climate research on how the Earth is changing as temperatures rise and what those changes will mean for the future.
We asked climate scientist Robert Kopp, a lead author of the chapter on Earth’s oceans, ice and sea level rise, about the profound changes underway.
What are the IPCC report’s most important overall messages in your view?
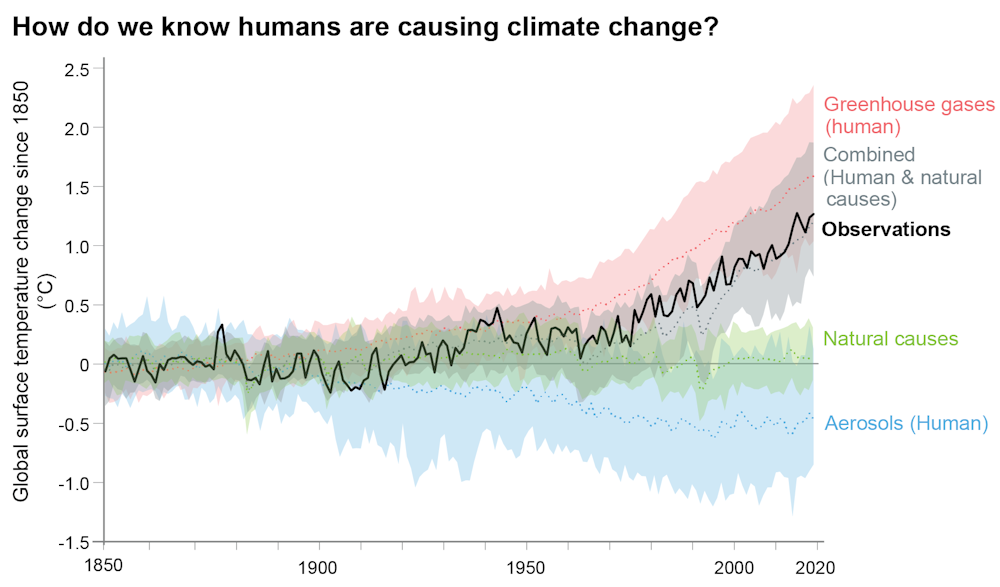
At the most basic level, the facts about climate change have been clear for a long time, with the evidence just continuing to grow.
As a result of human activities, the planet is changing at a rate unprecedented for at least thousands of years. These changes are affecting every area of the planet.
While some of the changes will be irreversible for millennia, some can be slowed and others reversed through strong, rapid and sustained reductions in greenhouse gas emissions.
But time is running out to meet the ambitious goal laid out in the 2015 international Paris Agreement to limit warming to well below 2 degrees Celsius above preindustrial levels (2 C equals 3.6 degrees Fahrenheit). Doing so requires getting global carbon dioxide emissions on a downward course that reaches net zero around or before 2050.
 |
| Humans produce large amounts of greenhouse gas emissions, primarily through fossil fuel burning, agriculture, deforestation and decomposing waste. IPCC Sixth Assessment Report |
What are scientists most concerned about right now when it comes to the oceans and polar regions?
Global sea level has been rising at an accelerating rate since about 1970, and over the last century, it has risen more than in any century in at least 3,000 years.
In the years since the IPCC’s Fifth Assessment Report in 2013 and the Special Report on the Ocean and Cryosphere in a Changing Climate in 2018, the evidence for accelerating ice sheet loss has become clearer.
Over the last decade, global average sea level has risen at a rate of about 4 millimeters per year (1.5 inches per decade). This increase is due to two main factors: the melting of ice in mountain glaciers and at the poles, and the expansion of water in the ocean as it takes up heat.
Ice sheets in particular are primarily responsible for the increase in the rate of sea level rise since the 1990s. There is clear evidence tying the melting of glaciers and the Greenland Ice Sheet, as well as ocean warming, to human influence.
Sea level rise is leading to substantial impacts on coastal communities, including a near-doubling in the frequency of coastal flooding since the 1960s in many sites around the world.
Since the previous reports, scientists have made substantial advances in modeling the behavior of ice sheets. At the same time, we’ve been learning more about ice sheet physics, including recognizing the potential ways ice sheets can become destabilized.
We don’t well understand the potential speed of these changes, but they have the potential to lead to much more rapid ice sheet loss if greenhouse gas emissions grow unchecked.
These advances confirm that sea level is going to continue to rise for many centuries to come, creating an escalating threat for coastal communities.
Sea level change through 2050 is largely locked in: Regardless of how quickly nations are able to lower emissions, the world is likely looking at about 15 to 30 centimeters (6 to 12 inches) of global average sea level rise through the middle of the century.
But beyond 2050, sea level projections become increasingly sensitive to the world’s emissions choices. If countries continue on their current paths, with greenhouse gas emissions likely to bring 3-4 C of warming (5.4-7.2 F) by 2100, the planet will be looking at a most likely sea level rise of about 0.7 meters (a bit over 2 feet). A 2 C (3.6 F) warmer world, consistent with the Paris Agreement, would see lower sea level rise, most likely about half a meter (about 1.6 feet) by 2100.
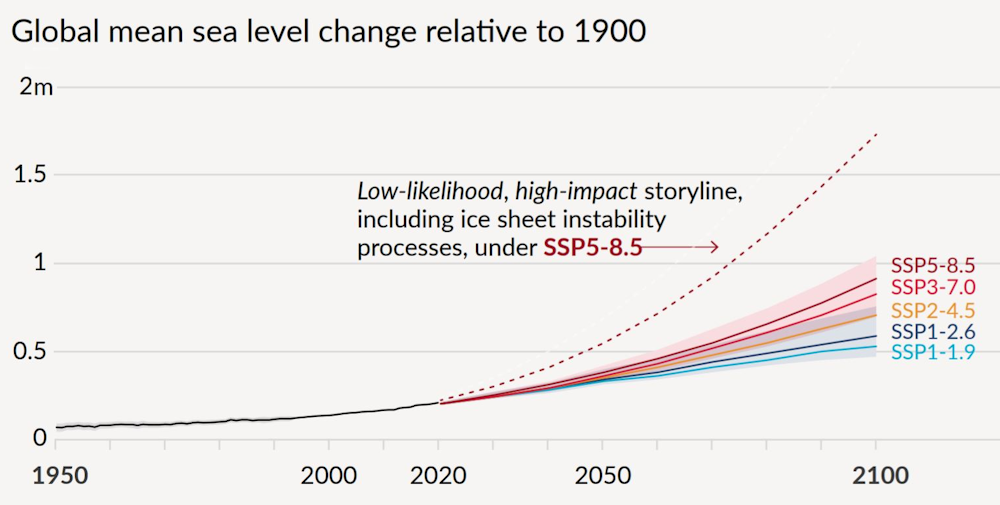 |
| The IPCC’s projections for global average sea level rise in meters with higher-impact pathways and the level of greenhouse gas emissions. IPCC Sixth Assessment Report |
What’s more, the more the world limits its greenhouse gas emissions, the lower the chance of triggering instabilities in the polar ice sheets that are challenging to model but could substantially increase sea level rise.
Under the most extreme emissions scenario we considered, we could not rule out rapid ice sheet loss leading to sea level rise approaching 2 meters (7 feet) by the end of this century.
Fortunately, if the world limits warming to well below 2 C, it should take many centuries for sea level rise to exceed 2 meters – a far more manageable situation.
Are the oceans or ice nearing any tipping points?
“Tipping point” is a vague term used in many different ways by different people. The IPCC defines tipping points as “critical thresholds beyond which a system reorganizes, in a way that is very fast or irreversible” – for example, a temperature rise beyond which climate dynamics commit an ice sheet to massive loss.
Because the term is so vague, the IPCC generally focuses on characteristics of changes in a system – for example, whether a system might change abruptly or irreversibly – rather than whether it fits the strict dynamic definition of a “tipping point.”
One example of a system that might undergo abrupt changes is the large-scale pattern of ocean circulation known as the Atlantic Meridional Overturning Circulation, or AMOC, of which the Gulf Stream is part.
Paleoclimate evidence tells us that AMOC has changed rapidly in the past, and we expect that AMOC will weaken over this century. If AMOC were to collapse, it would make Europe warm more slowly, increase sea level rise along the U.S. Atlantic coast, and shift storm tracks and monsoons. However, most evidence indicates that such a collapse will not happen in this century.
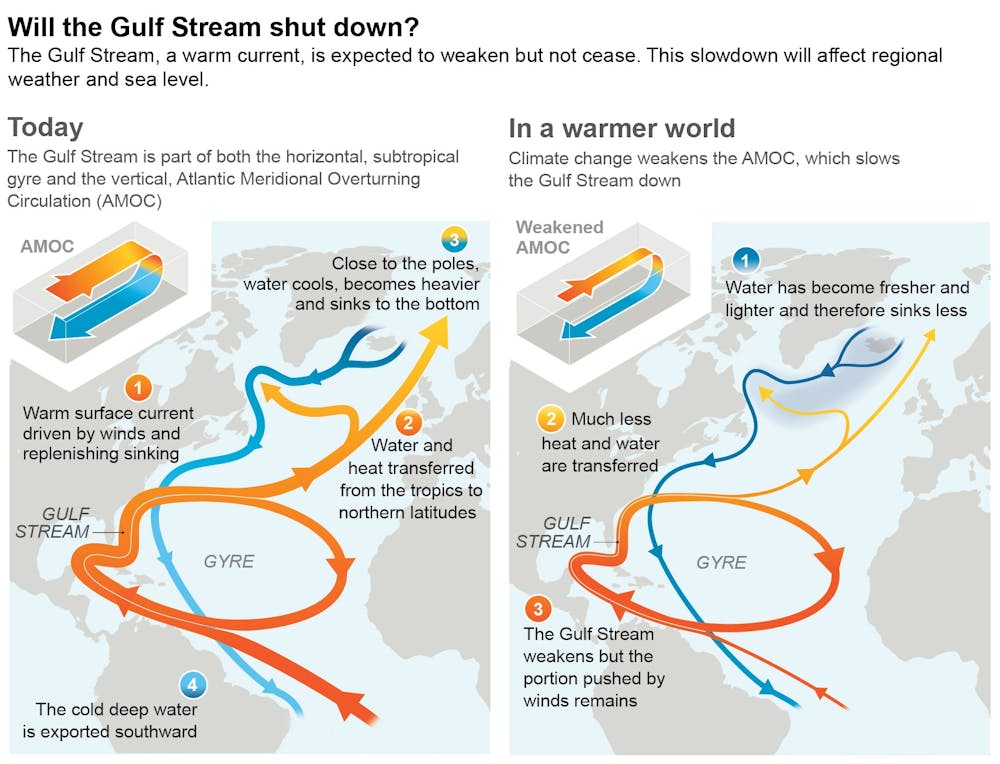 |
| The Gulf Stream is part of the Atlantic Meridional Overturning Circulation. A slowdown would affect temperature in Europe and sea level rise along the U.S. East coast. IPCC Sixth Assessment Report |
There is mixed evidence for abrupt changes in the polar ice sheets, but clear evidence that changes in the ice sheets can be locked in for centuries and millennia.
If the world succeeds in limiting warming to 1.5 C (2.7 F), we expect to see about 2-3 meters (7-10 feet) of sea level rise over the next 2,000 years; if the planet continues to warm and reaches a 5 C (9 F) increase, we expect to see about 20 meters (70 feet) over the next 2,000 years.
Some people also discuss summer Arctic sea ice – which has undergone substantial declines over the last 40 years and is now smaller than at any time in the past millennium – as a system with a “tipping point.” However, the science is pretty clear that there is no critical threshold in this system. Rather, summer Arctic sea ice area decreases roughly in proportion to the increase in global temperature, and if temperature were stabilized, we would expect sea ice area to stabilize also.
What do scientists know now about hurricanes that they didn’t realize when the last report was written?
Since the last IPCC assessment report in 2013, there has been increasing evidence that hurricanes have grown more intense, and intensified more rapidly, than they did 40 years ago. There’s also evidence that hurricanes in the U.S. are moving more slowly, leading to increased rainfall.
However, it’s not clear that this is due to the effects of greenhouse gases – reductions in particulate pollution have also had important effects.
The clearest effect of global warming is that a warmer atmosphere holds more water, leading to more extreme rainfall, like that seen during Hurricane Harvey in 2017. Looking forward, we expect to see hurricane winds and hurricane rains continue to increase. It’s still unclear how the overall number of hurricanes will change.
The report involved 234 scientists, and then 195 governments had to agree on the summary for policymakers. Does that broad range of views affect the outcome?
When you’re writing a report like this, a key goal for the scientists is to accurately capture points of both scientific agreement and scientific disagreement.
For example, with respect to ice sheet changes, there are certain processes on which there is broad agreement and other processes where the science is still emerging and there are strong, discordant views. Yet knowing about these processes may be crucially important for decision-makers trying to manage risk.
That’s why, for example, we talk not only about most likely outcomes, but also about outcomes where the likelihood is low or as-yet unknown, but the potential impacts are large.
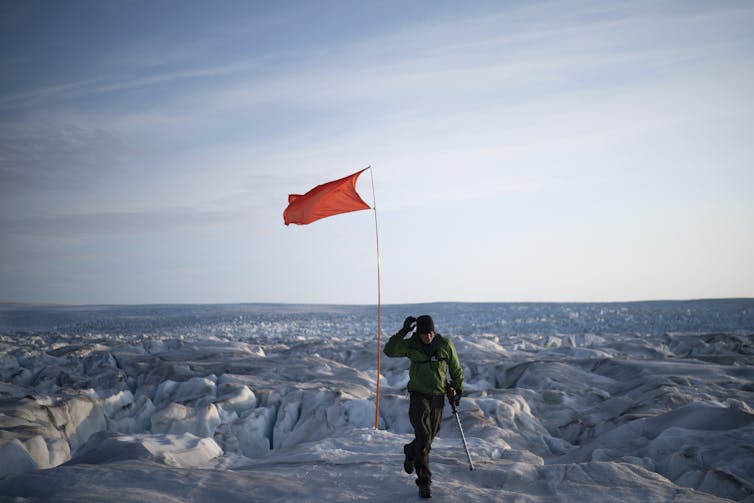 |
| A scientist plants a flag to identify a GPS position on Greenland’s Helheim Glacier in 2019. The glacier had shrunk about 6 miles (10 kilometers) since scientists visited in 2005. AP Photo/Felipe Dana |
I’m very pleased that, as with past reports, every participating government has signed off on a summary that accurately reports the current state of climate science.
Robert Kopp, Professor, Department of Earth & Planetary Sciences, and Director, Rutgers Institute of Earth, Ocean, and Atmospheric Sciences, Rutgers University
This article is republished from The Conversation under a Creative Commons license. Read the original article.
[Over 100,000 readers rely on The Conversation’s newsletter to understand the world. Sign up today.]